LANforge-ICEcap Users Guide
Table of Contents
Overview
- Main ICEcap Window
Overview
The LANforge-ICEcap feature is designed to allow one to probe any
network path and save the results to an XML file. This file can be
replayed in LANforge-ICE allowing LANforge-ICE to replicate the
latency, dropped packet percentage, and other behaviours of the
probed network in a controlled manner.
-
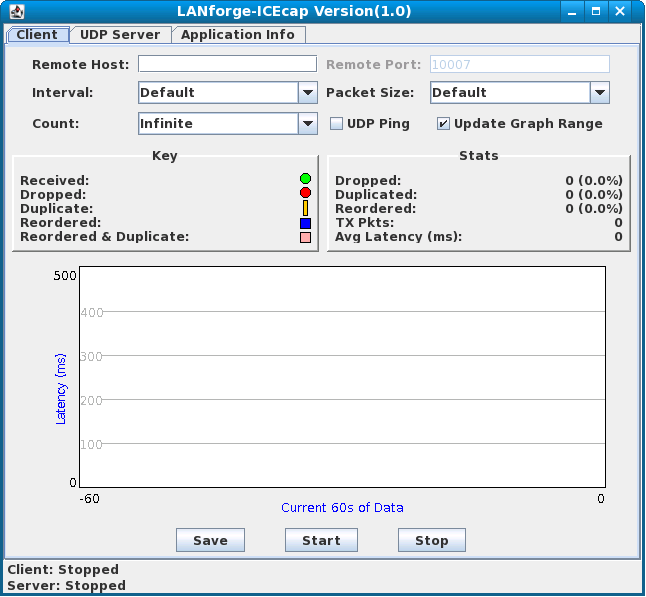
Main ICEcap Window
After installing LANforge-ICEcap, you
are ready to begin. First, start up LANforge-ICEcap. It should pop up two
windows, one being the main window, and another that is the console output
for low-level details and debugging output. Unless there is some problem
with your test, you can safely ignore the console window.
The main window looks like this:
- Destination
- Specify the IP address or hostname for the remote network device to probe.
The resulting file will capture the latency and packet loss between the
machine running ICEcap and this destination machine.
- Ntwk Interface
- Specify the Network Interface to use on the local machine. Leave this blank
unless you know you need to use a specific interface instead of the default
interface as selected by the operating system.
- Sample Interval
- Specify (in seconds) how long each sample interval is. The samples
sent during the sample interval will be averaged together and saved
as a single entry in the resulting XML file.
- Duration
- Specify (in seconds) how long the ICEcap probe session should last.
- Sample Per Interval
- Specify how many samples (probes) we should send per each interval.
- Payload Size
- Specify the size (in bytes) of the probe packet.
- Result File Name
- Specify the name of the file in which to store the results. The
raw data will be saved in <file-name>.dat and the XML file suitable
for replay by LANforge will be called <file-name>.xml.
- Other Args
- If you want to pass any other arguments to the hping2 program, you
can enter them in this field. This is not normally required.
- Email Server
- If you want ICEcap to automatically mail the results to you
then specify your SMTP mail server here. ICEcap will attempt to
connect directly to this server and speak SMTP in order to send the
email. It is likely that your mail server will need to be configured
to allow this direct accesss.
- My Email
- Specify your email address. This will be used for the 'From' field
in the email generated by ICEcap.
- To Email
- Specify the email address to which the email should be sent.
- Auto Mail
- If this option is selected, the email will be automatically sent as
soon as the probe session completes. Un-select this if you do not
want to send email.
- Send Mail
- If this button causes email to be sent immediately.
- Run
- Starts the probe session.
- Stop
- Stops a running probe probe session immediately.
- Exit
- Exits the ICEcap application immediately.
- Progress
- Displays the current progress for the probe session.

